Range
Range Study
A range study allows each global variable to be assigned either a fixed value or a range of values. In a range study, the experiments are created automatically by Möbius as the cross product of all possible values the global variables may take. For example, if there are two global variables, each of which is assigned a range of six values, the study will be composed of 36 experiments. The editor for a newly created range study is shown in <xr id="fig:studies_newrange" />. The name of each global variable defined in the child model is displayed in the table, along with its type and value (initially zero). You can reorder or resize the columns by clicking and dragging on the appropriate column header or border.
<figure id="fig:studies_newrange">

To enter a fixed value for a variable, simply click in the corresponding Variable Value text box and enter the value. To enter a range for a variable, click on the appropriate button at the bottom of the dialog (Incremental Range, Functional Range, Manual Range, or Random Range). An example of a completed range study can be found in <xr id="fig:studies_range" />. Note that if a variable is assigned a fixed value, that value is displayed in the table. Likewise, if a variable is assigned a range of values, the type of range is displayed.
<figure id="fig:studies_range">

Incremental range
An incremental range is specified with a starting value, an ending value, and an increment, which may be additive, multiplicative, or exponential. <xr id="fig:studies_incrange" /> shows the dialog. The first three elements of the dialog show the name of the study, the name of the variable being assigned, and the type of this variable.
<figure id="fig:studies_incrange">

A variable defined with an incremental range will take on all values between Initial and Final at increments of Increment. That is, if  represents the initial value,
  represents the final value, and
  represents the increment, the variable will take on values for the different increment types according to <xr id="tab:studies_increments" />. Click on the View Values button to see a list of all the values the variable will take on in this range. The list may be exported to a text file.
<figtable id="tab:studies_increments">
| Increment Type | Values |
|---|---|
| Additive | 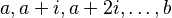
|
| Multiplicative | 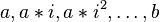
|
| Exponential | 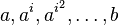
|
Functional range
A functional range is essentially a function of an incremental range. An incremental range is defined as in Section 7.1.1 to be the domain, and the functional range is obtained by applying a function to every element in the domain. Thus, the top half of the Functional Range dialog is identical to the Incremental Range dialog. The function may be a standard function, such as  or
or  using the Range f(x) option, or a specialized function (e.g., quadratic, exponential, or linear) using the Range f(x,n) boxes.
For example, if the incremental range shown in <xr id="fig:studies_incrange" /> was used as the domain and  was used as the function, the result would be the dialog in <xr id="fig:studies_funcrange" /> and the values in <xr id="tab:studies_funcrange" />.
<figure id="fig:studies_funcrange">

<figtable id="tab:studies_funcrange">
| Domain x | Range f(x) |
|---|---|
| 5.0 | 25.0 |
| 10.0 | 100.0 |
| 15.0 | 225.0 |
| 20.0 | 400.0 |
| 25.0 | 625.0 |
| 30.0 | 900.0 |
Manual range
Specify a manual range by entering each value in the range separately. To add a value to the range, enter the value in the New Value text box and click Enter. The values in the range are displayed in the Current Values box. The five buttons to the right of this box can be used to manipulate the values in the range as follows:
- Up: Move a value up in the list
- Down: Move a value down in the list
- Delete: Delete the selected value from the list
- Delete All: Delete all values in the list
- Import: Import values from a text file
The incremental range in <xr id="fig:studies_incrange" /> could equivalently be represented by the manual range in <xr id="fig:studies_manrange" />. For this example, it would be more convenient to use an incremental range than to enter each value in the range manually. However, a manual range is necessary if you wish to specify range values that do not follow a regular pattern.
<figure id="fig:studies_manrange">

Random range
A random range allows you to assign random values to global variables. Enter into the Number of Samples text box the number of random values to generate within the range defined by Minimum Value and Maximum Value. <xr id="fig:studies_randrange" /> shows an example in which the variable arr_rate is assigned 6 random values between 5 and 30.
<figure id="fig:studies_randrange">

Clicking the View Values button will display the pseuorandomly generated values, which may be exported to a text file. To create new values using a different seed, click the Regenerate button. The resulting values will be the actual values for the global variable used by the solver.